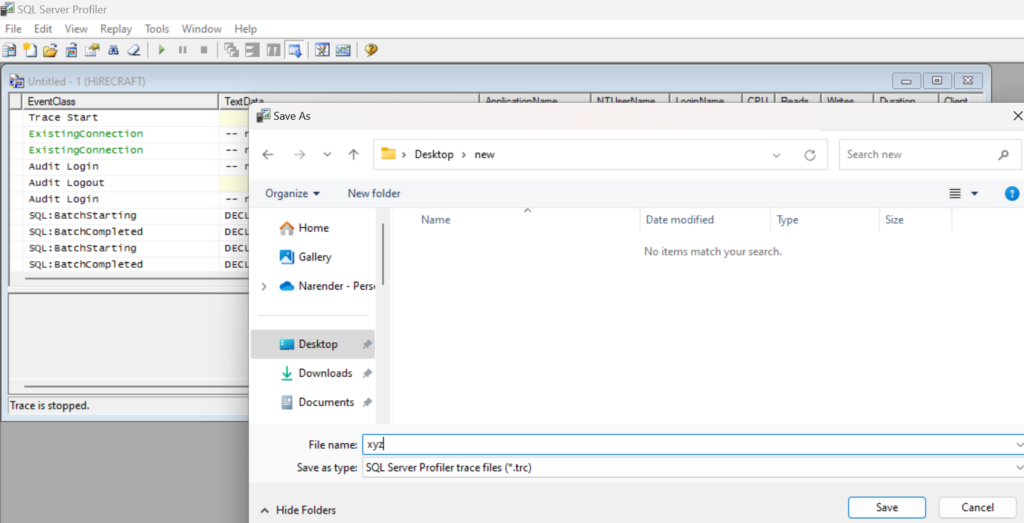
1.Save the Trace File:
- Open SQL Server Profiler.Configure the trace by setting the events and filters as needed.Start the trace.Save the trace results to a file by selecting
File>Save As>Trace File.Provide a file name xyz and save it.

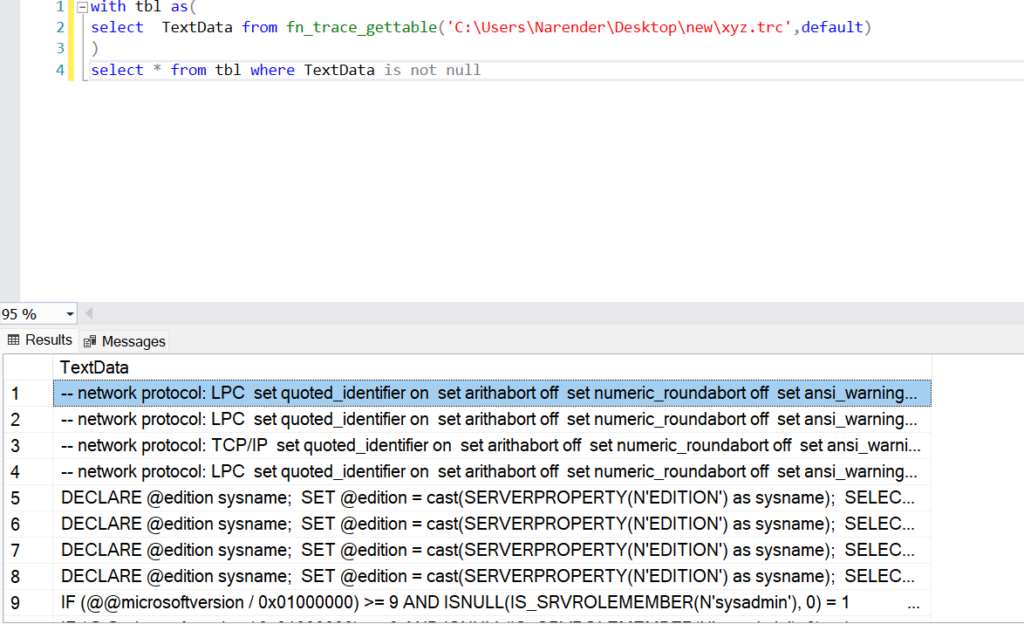
2.Read the Trace File Using T-SQL:
- Use the
fn_trace_gettablefunction to read the trace file.
Here is an example T-SQL command to read the saved trace file:
